SecPublica 2016
I have had a tremendous opportunity to be a speaker at the SecPublica 2016 security conference held in Prague on 31st March. All the speakers – including myself – gave the talks in Czech and therefore the presentation slides and videos are useful only for you guys from the Czech (and Slovak) Republic.
Feel free to check them out for yourself at http://www.secpublica.cz/2016/. There are however a few things worth noting from my preparations for this talk I would like to write here about.
The topic of my talk was once again about elliptic curve cryptography. But this time I tried hard to make it as much down to Earth as possible. The key to successful presentation is a good combination of appealing pictures, good structure, and nice performance of the speaker. It is for others to judge my performance, yet there are tools that help me with that and I will quickly introduce them to you.
Appealing pictures
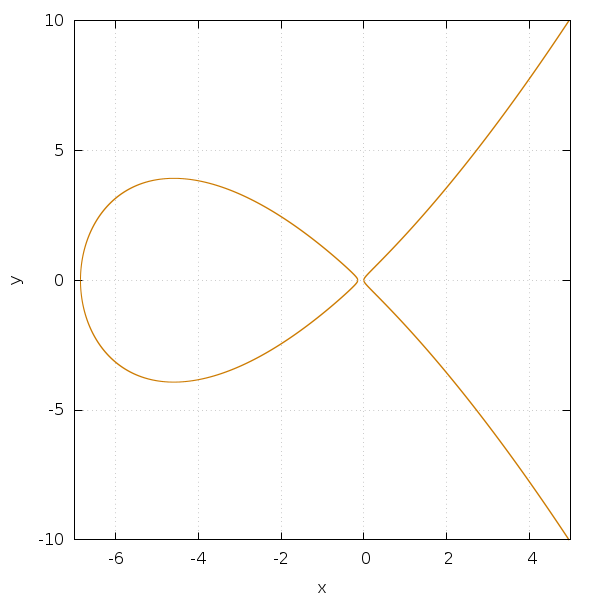
One picture is more than a thousand words. Or so they say. Explaining the advanced mathematics on cyclic groups formed by points of an elliptic curve over a finite field turned out to be relatively easy task given nice pictures I brought. The smooth variants of elliptic curves were pretty straightforward to produce using an excellent software package „gnuplot“ (http://www.gnuplot.org/). An example of Montgomery curve was created using the following gnuplot source:
set terminal pngcairo size 600,600
set output 'em-smooth.png'
set xlabel 'x'
set ylabel 'y'
set samples 1000000
set grid
plot[-7:5][-10:10] \
 sqrt(((x**3)+7*(x**2)+x)/3) lc rgb '#cc7a00' title '', \
 -sqrt(((x**3)+7*(x**2)+x)/3) lc rgb '#cc7a00' title ''
Yes, the oversampling is necessary because of the steep slope near y=0, but the resulting picture is simply amazing:
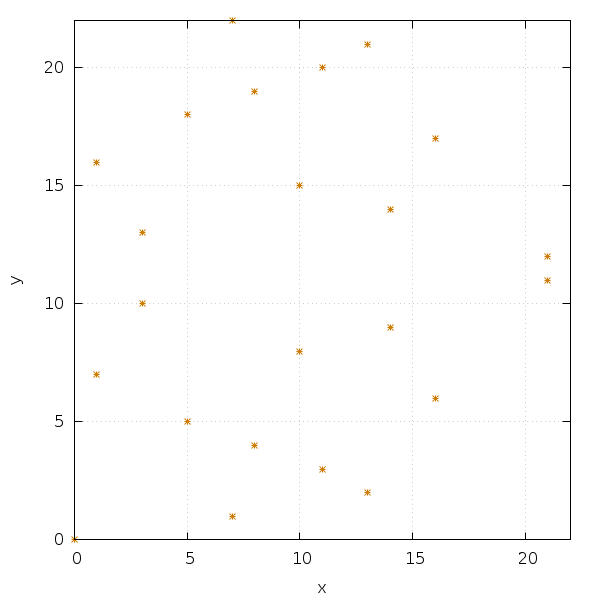
Contrary to the smooth variant, it would be complicated to try drawing discrete version of such curve – over a finite field – using gnuplot alone. Therefore I wrote a simple ruby (https://www.ruby-lang.org/en/) script to produce the discrete values and then used gnuplot once again just for rendering the result. For the example I used 23 as the prime number delimiting the finite field which means X and Y values we distributed between 0 and 22 (inclusive). The ruby script source for this should look familiar:
23.times do |x|
  23.times do |y|
    a = (3*y*y)%23
    b = (x*x*x+7*x*x+x)%23
    if a == b
      puts([x,y].join(" "))
    end
  end
end
And corresponding gnuplot file is here as well:
set terminal pngcairo size 600,600
set output 'em-discrete.png'
set xlabel 'x'
set ylabel 'y'
set grid
plot[0:22][0:22] 'em-discrete.data' u 1:2 lc rgb '#cc7a00' pt 3 title ''
So that is it – a discrete version of Montgomery curve:
Well arranged information
Writing uncluttered structured documents is a task that requires certain amount of experience. But why rely only on your experience, when you can leverage tools used by others that help you write such documents. LaTeX (http://www.latex-project.org/) is one of my favourite tools for doing this. Built upon the foundation of Donald E. Knuth’s typesetting system TeX (http://tug.org/) it provides semantic document structuring macros which help a lot by enforcing certain level of consistency when writing longer texts.
LaTeX Beamer (https://bitbucket.org/rivanvx/beamer/wiki/Home) is LaTeX document class dealing with projecting presentation slides on (presumably big) screens. It is also highly customizable which allowed me to simply adapt our company design as a Beamer theme:
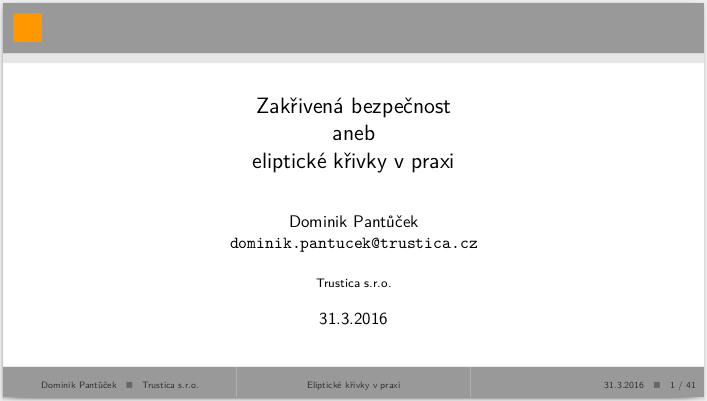
If you are unfamiliar with LaTeX and Beamer especially, you may like the source for this particular frame:
\begin{frame}{~}
  \titlepage
\end{frame}
Simple, isn’t it?
Presentation software
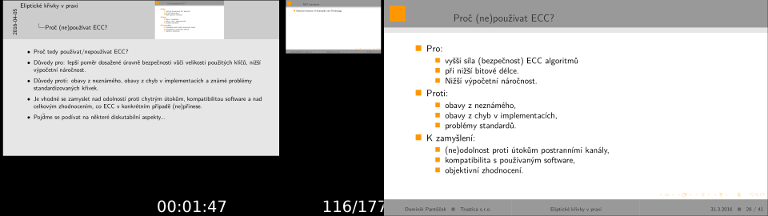
As I mentioned, the third important part composing the success (or failure) of any talk is the performance of the speaker. I do not know a thing about acting so I decided to get help from the machine. LaTeX Beamer can produce PDF presentations which are well-suited for displaying on two screens. First screen is for the audience and the other one is for your notes about particular slide. There is also available an excellent viewer for such two-screen presentations called pdfpc (https://pdfpc.github.io/). This is a piece of software that really helps you with the presentation a lot. You have to write useful notes though…
As I mentioned earlier, one picture is worth more than a thousand words:
Another good thing about pdfpc – and the whole X11/Linux stack underneath it – is a full support for my favourite presenter – the Logitech R400. You just plug it in an USB port and your next and previous buttons work immediately. I find a bit unfortunate the „play“ button sends alternating F5 and ESC codes, but I use it only for exiting from the presentation so it does not matter anyway.
I hope you enjoyed reading today’s writing and did not mind I was bragging too much. See ya all next week again!